Home Assistant - Better Proxmox Monitoring with InfluxDB
In this post I will show how I used the External Metric Server feature in Proxmox to set up the best possible integration between Proxmox and Home Assistant.

The default Proxmox VE integration in Home Assistant basically only tells you which containers are running. But what if you want an automation to trigger if storage is running low, or if a specific VM's CPU is pegged?
Proxmox actually provides a way to expose its metrics to an external database. In this post I will show how I used the External Metric Server feature in Proxmox to set up the best possible integration between Proxmox and Home Assistant.
InfluxDB Setup
InfluxDB will serve as the database for Proxmox metrics which can be accessed by Home Assistant. The quickest way to get up and running with InfluxDB is to install it as an add-on in Home Assistant. The add-on comes bundled with Chronograf which makes this setup much easier to manage.
- Install the InfluxDB add-on in Home Assistant.
- Adjust the configuration if needed, then start the add-on.
- Once the add-on is running, use the OPEN WEB UI button to ingress into the Chronograf web interface to confirm that it is up and running
Cronograf Web Interface
- Now you need to add a database for Proxmox to write to. Go to the InfluxDB Admin panel and create a new database called
proxmox. Adjust the duration of the default retention policy to a reasonable limit.
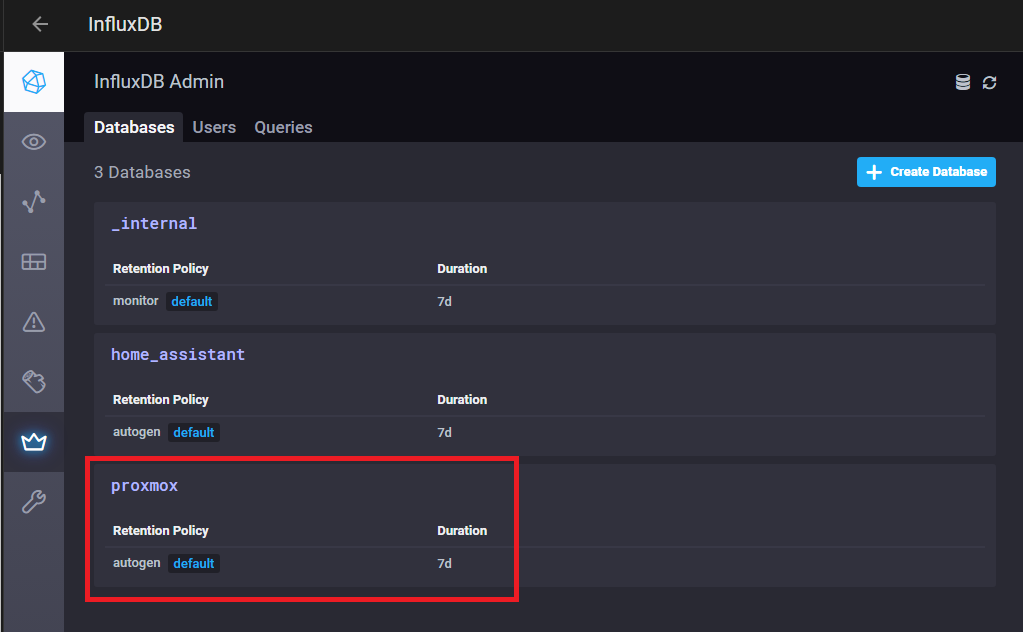
New database
- Finally, you need a user with permissions to access the database. Go to the users tab and create a user called
proxmox. On the next page toggle on the WRITE and READ permissions for theproxmoxdatabase.
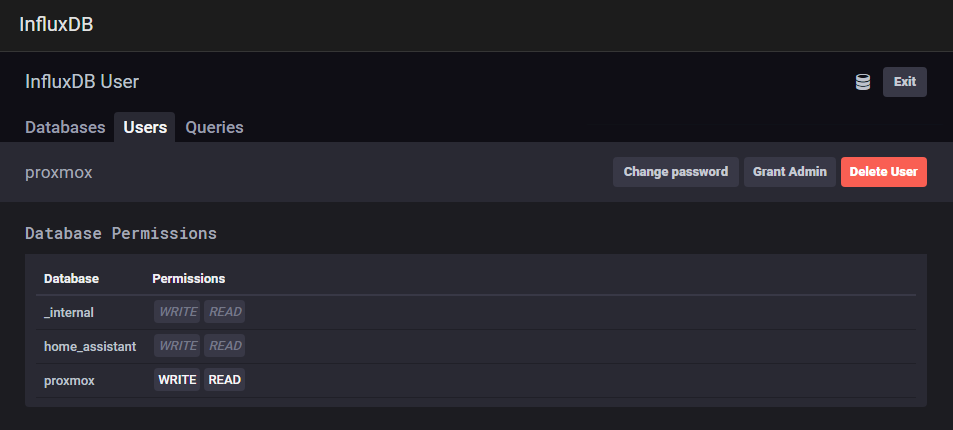
User permissions
Proxmox Setup
Now that the database is in place, you can configure it as an External Metrics Server in Proxmox.
- Log into your Proxmox web interface
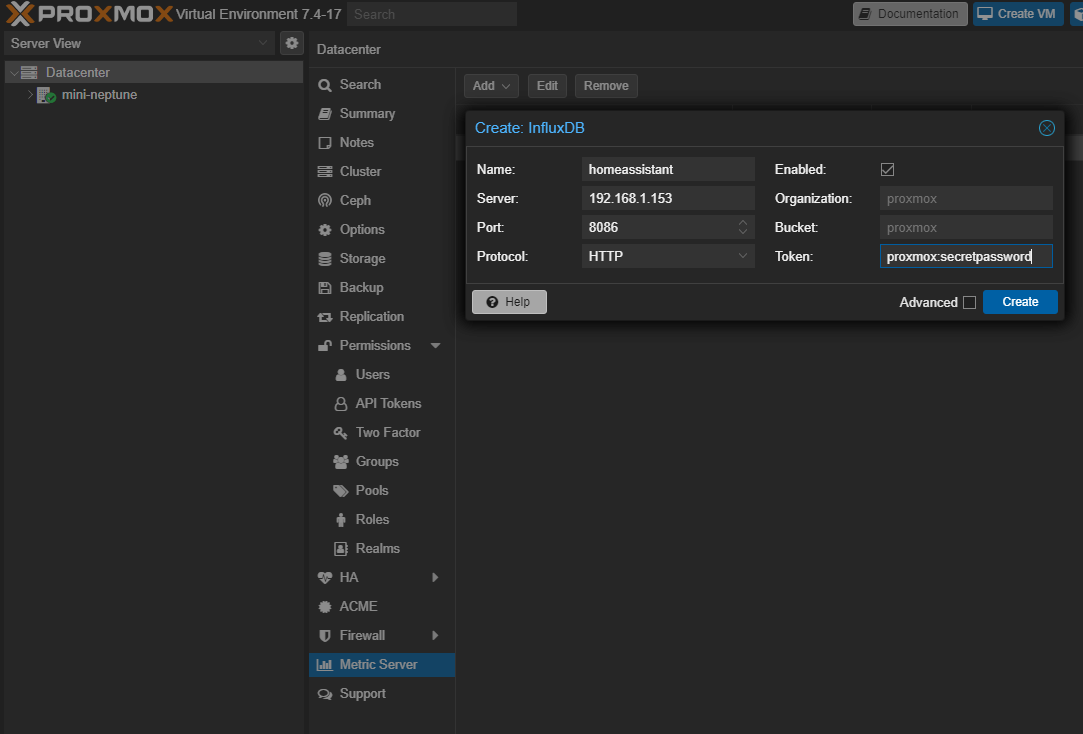
- Under Datacenter, go to Metric Server and Add a new InfluxDB connection.
- Give the connection a meaningful name, like
homeassistant. For the Server enter the IP of your Home Assistant installation. Set the port and protocol to match the configuration of the InfluxDB add-on. - Set the Token to
username:passwordreplacing username and password with the user you set up in InfluxDB.
- Save the database connection, then return to the InfluxDB interface to test it out.
- Go to the Explore tab and start a new Query. You should see the
proxmox.autogenretention policy. Drill down into theproxmox.autogenand go tosystem > vmidand tick one of your VMs. Choose a field from the right and you should see some data.
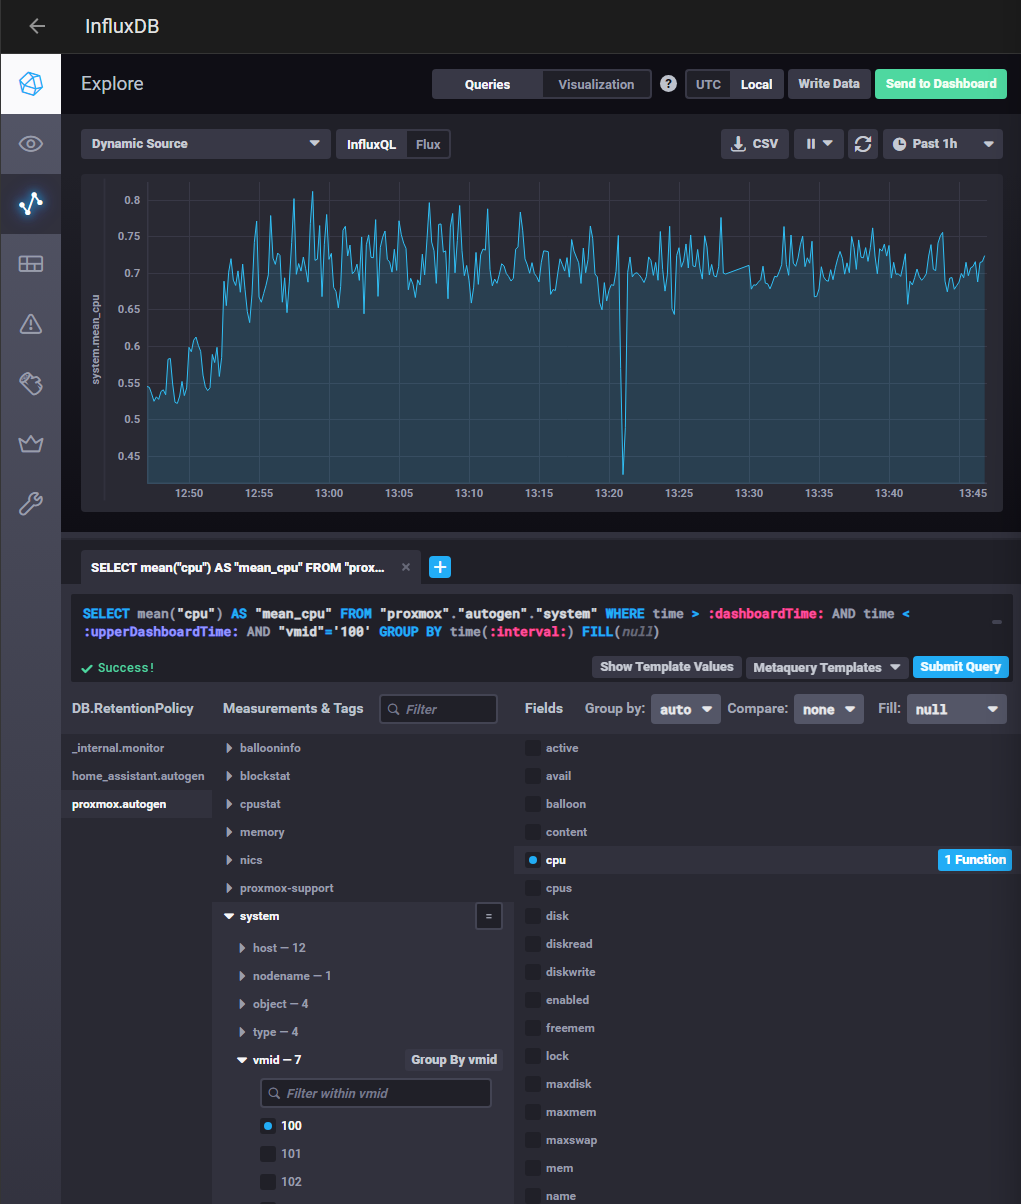
vmid 100 cpu query
- Try to familiarize yourself with the different measurements and fields available, and how the queries are constructed. In the next section will use these queries to build out sensors in Home Assistant.
Now that you have data flowing into InfluxDB, you can start setting up your sensors in Home Assistant.
Home Assistant Setup
As of when this guide was written, InfluxDB is still configured manually with YAML.
-
Optional step: Add another user in InfluxDB with read-only permissions on the
proxmoxdatabase. -
Add the InfluxDB integration to your configuration.yaml. This config simply enables the integration and blacklists all entities from being recorded.
influxdb:
  exclude:
    entity_globs: "*"
- Add the sensor platform to your configuration.yaml. Change the values below to match your setup.
sensor:
  - platform: influxdb
    host: a0d7b954-influxdb
    username: someusername
    password: somepassword
    scan_interval:
      seconds: 15
    queries:
      - name: InfluxDB Proxmox VM 100 CPU
        unique_id: '42946dc7-c9ac-4f7d-abb0-198f9435b738'
        database: proxmox
        measurement: proxmox.autogen.system
        where: "vmid='100'"
        field: '"cpu"'
        group_function: last
        value_template: "{{ (value|float * 100) | round(1) }}"
        unit_of_measurement: '%'
Notes:
group_functiondecides how the data is aggregated.lastsimply chooses the latest value in the selection, which is appropriate for a real-time sensor.value_templateis handy for transforming the data. The template above multiplies fractional value by 100 to get a percentage.scan_intervalis set to be slightly longer than the update interval in InfluxDB which is 10 seconds.
- Restart Home Assistant and locate the new entity
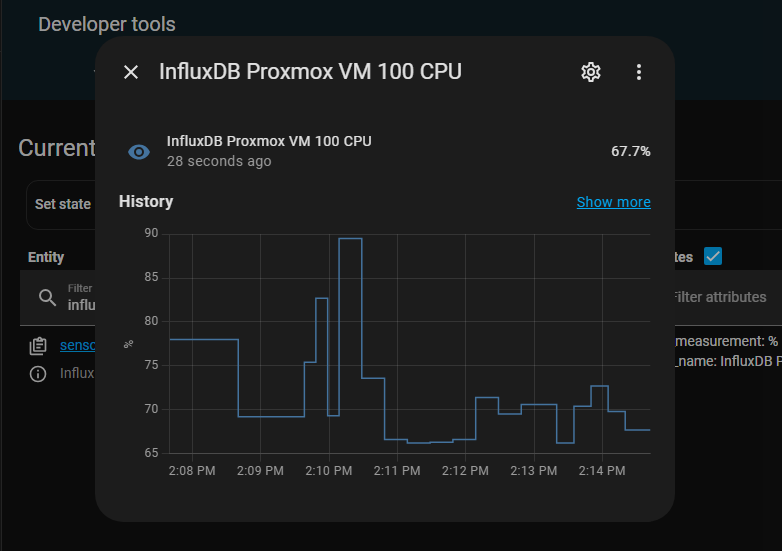
CPU usage sensor
- If you do not see the new sensor, check your system logs and search for 'influxdb'
Advanced Sensors
Now you can start getting more creative with your sensors. If you are not yet familiar with the InfluxQL query language, I recommend using the query builder in the add-on to construct your query, then translate it over to your YAML config. I will walk through this process with an example below.
High CPU Usage Sensor
Suppose you want a sensor to drive an automation that notifies you when your CPU is pegged. It may not be unusual for the CPU to occassionally spike, so you should consider taking the mean value over a period of time.
-
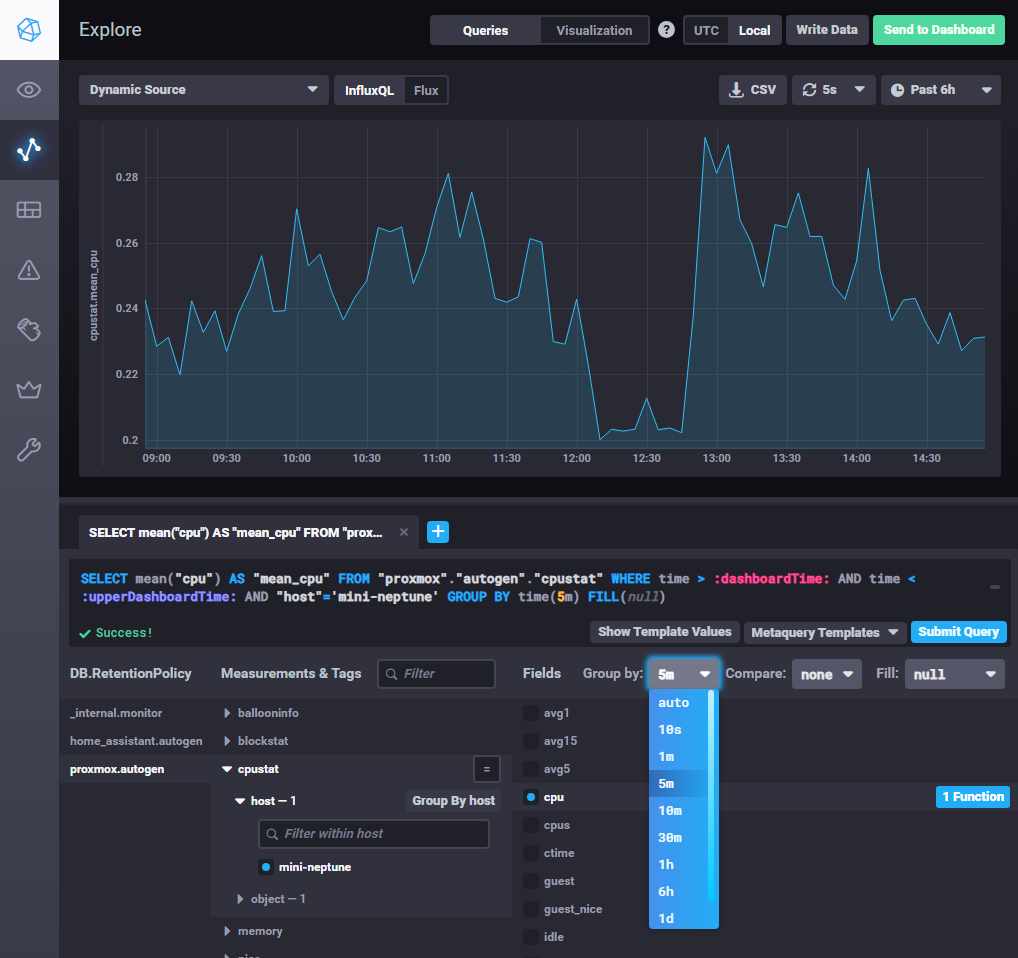
Go to the Explore tab again in the InfluxDB add-on and start a new query.
-
Choose the
proxmox.autogenretention policy. -
Under Measurements, expand
cpustatand tick your proxmox host. -
Under Fields, tick
cpuand apply themeanfunction.
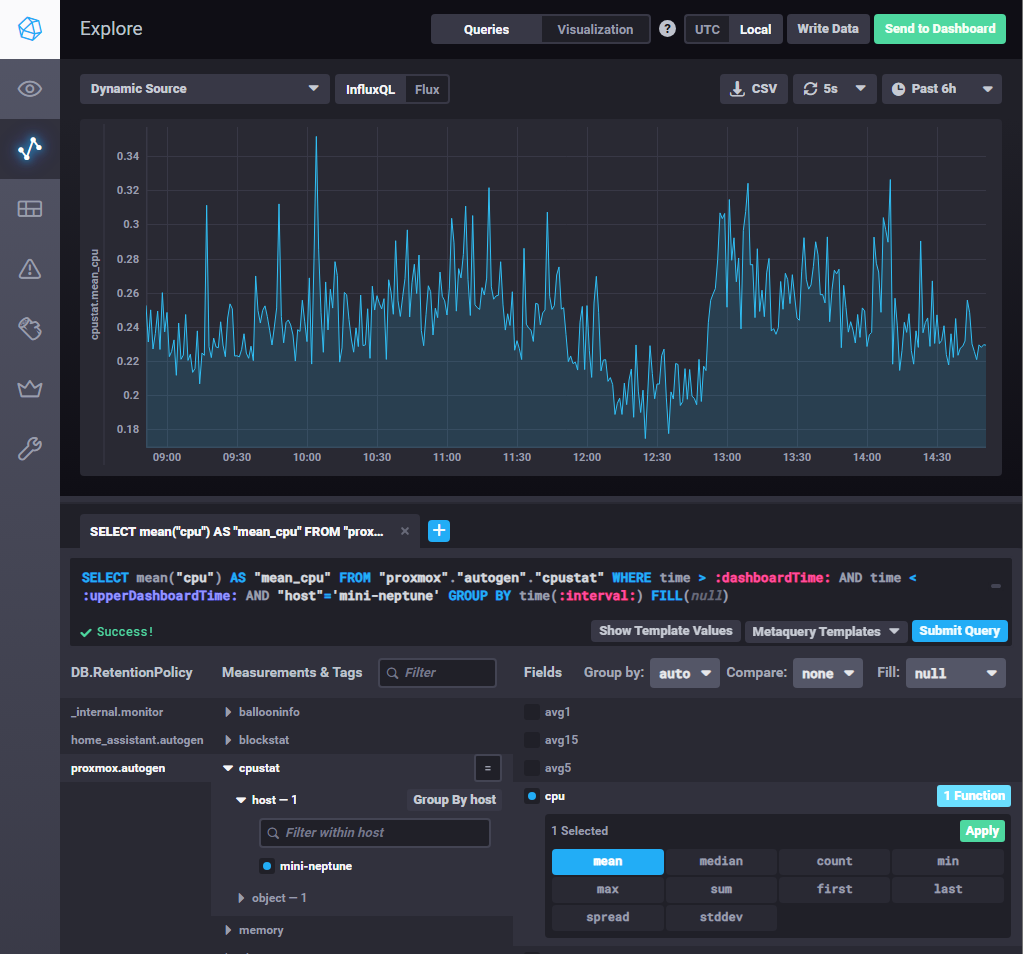
- Use the Group by dropdown to adjust the range of time over which the mean is computed. Notice that as you increase the duration of the mean, the resulting graph will smooth out the sharp peaks and valleys. This is exactly what we want to make sure those momentary CPU spikes don't trigger our automation.
- Once the query is set up to your liking, you can translate it over to your configuration.yaml. Your code may differ from the below.
- name: InfluxDB Proxmox Host CPU 5m Average Usage
  unique_id: 'c9e2ca8b-48fa-4856-84ad-7a1f671735fa'
  database: proxmox
  measurement: proxmox.autogen.cpustat
  field: "cpu"
  group_function: mean
  where: "host='mini-neptune' AND time > now() - 5m AND time < now()"
  value_template: "{{ (value|float * 100) | round(1) }}"
  unit_of_measurement: '%'
Note that the home assistant yaml syntax does not provide an easy way to set the group-by interval and will therefore group by the entire selected range of values. We adjust for this by adding a 5 minute time window to the where clause.
- Restart home assistant and check for the new sensor. Now you can trigger an automation if the sensor hits a certain while filtering out any momentary spikes!
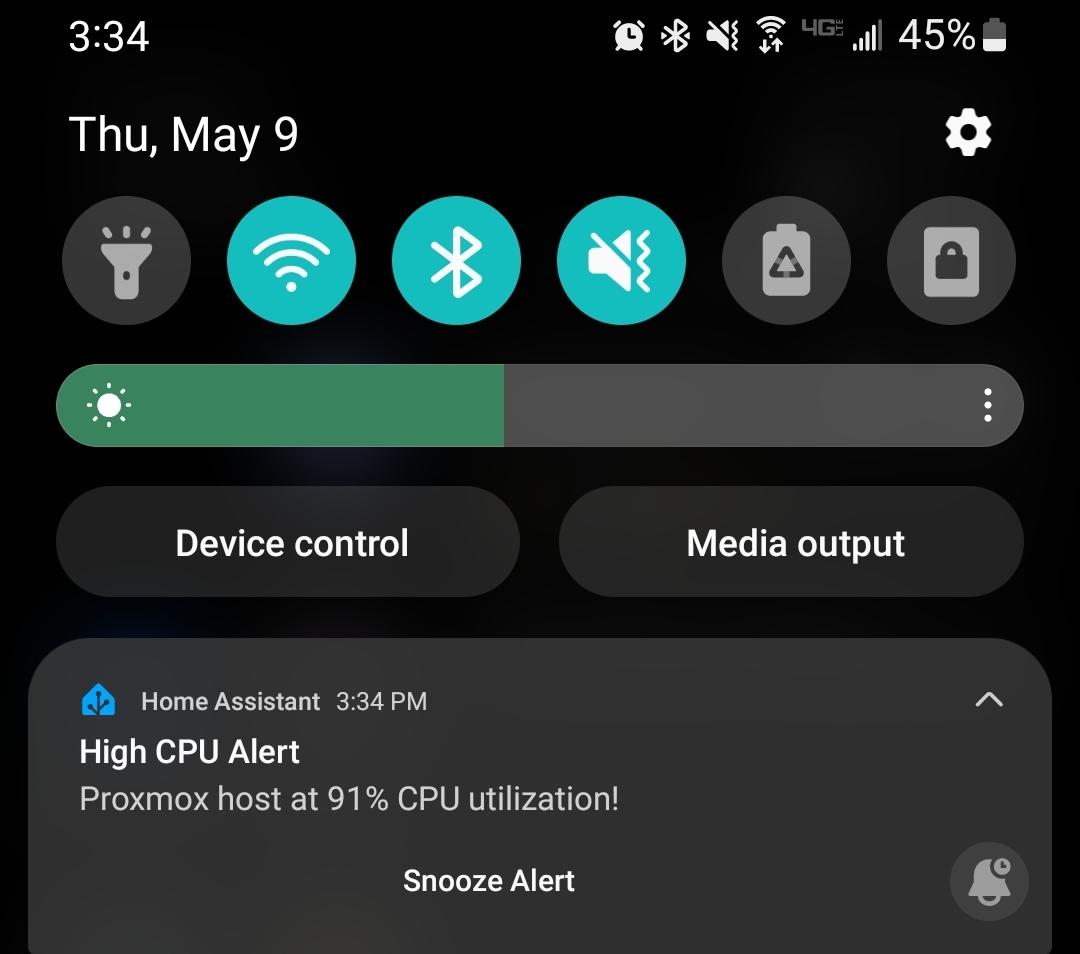
High CPU notification
Conclusion
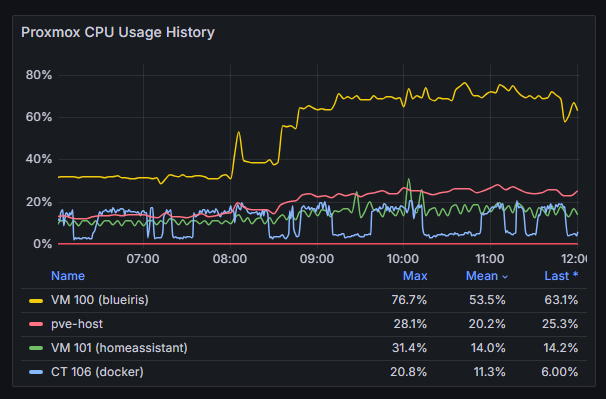
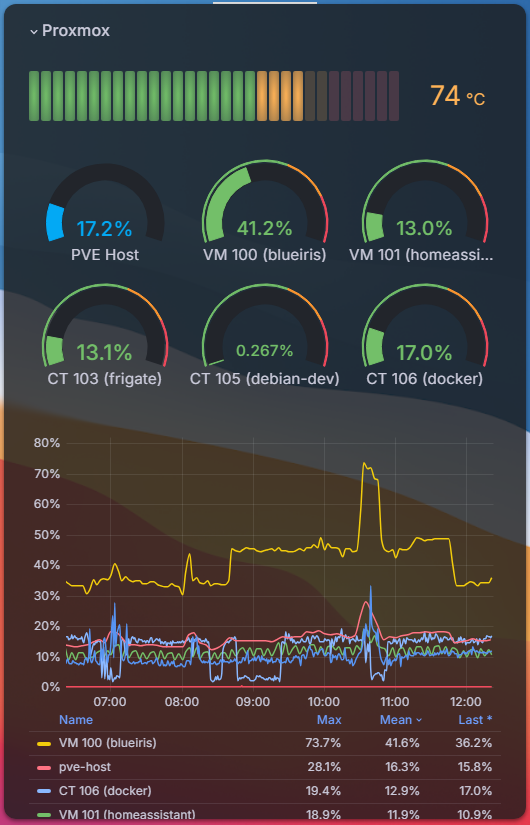
This InfluxDB integration gives you the best insight possible into the status of your Proxmox system by hooking directly into your system's metrics. This setup gives the most accurate real-time insight into your PVE host and all of your VMs and containers so that you can build meaningful automations and dashboards.
You can even take this a step further by installing the Grafana addon to build even more advanced visualizations.
Thanks for reading!